Alertmanager plugin — Setup & first alert
This guide takes you from a fresh install to a real Prometheus alert landing in a Mattermost channel with copy-paste-runnable diagnostics. It touches two systems; every step is tagged [Mattermost] or [Alertmanager] so you always know which one you're in.
How it fits together
 [Prometheus]                 [Alertmanager]                 [Mattermost]
 rules fire  ──alerts──▶  routes to a receiver ──POST──▶  incoming webhook
                                                          /hooks/<id>
                                                             │
                                                             ▼
                                              channel post + runbook diagnostics
                                              (kubectl cmds, ns/pod filled in)

 The plugin GENERATES the Alertmanager receiver config and OWNS the webhook.
 You paste that config into your Alertmanager. One handoff.

 (optional)  [Prometheus] ──scrape──▶ plugin /metrics   [Bearer: MetricsToken]
The single most important idea: the plugin doesn't receive alerts from Prometheus directly. It hands you an Alertmanager receiver (a webhook URL + a message template), you wire that into Alertmanager, and Alertmanager posts the rendered alert to Mattermost.
Prerequisites
- [Mattermost] System Admin access, server v10.5+.
- [Alertmanager] A running Prometheus + Alertmanager you can edit and reload.
- For the runbook
kubectlcommands to be runnable, alerts need anamespace(and usuallypod) label — see Step 6.
Step 1 — Install & enable the plugin [Mattermost]
Download the release asset — com.mattermost.alertmanager-<version>.tar.gz
from the release's Assets — and upload it in System Console → Plugins →
Plugin Management. Enable it.
⚠ Do not download the "Source code (zip/tar.gz)" link. That's the repo source: it has no compiled binaries and its URLs are unsubstituted placeholders. Only the Assets bundle is a working plugin.

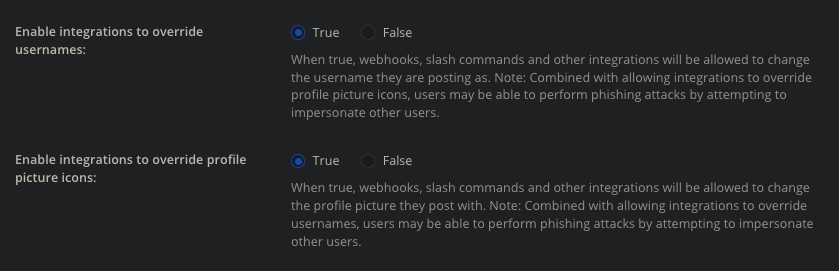
Then turn on username/icon overrides so alert posts render as
@alertmanagerbot, in System Console → Integrations → Integration
Management:
Step 2 — (Optional) plugin settings [Mattermost]
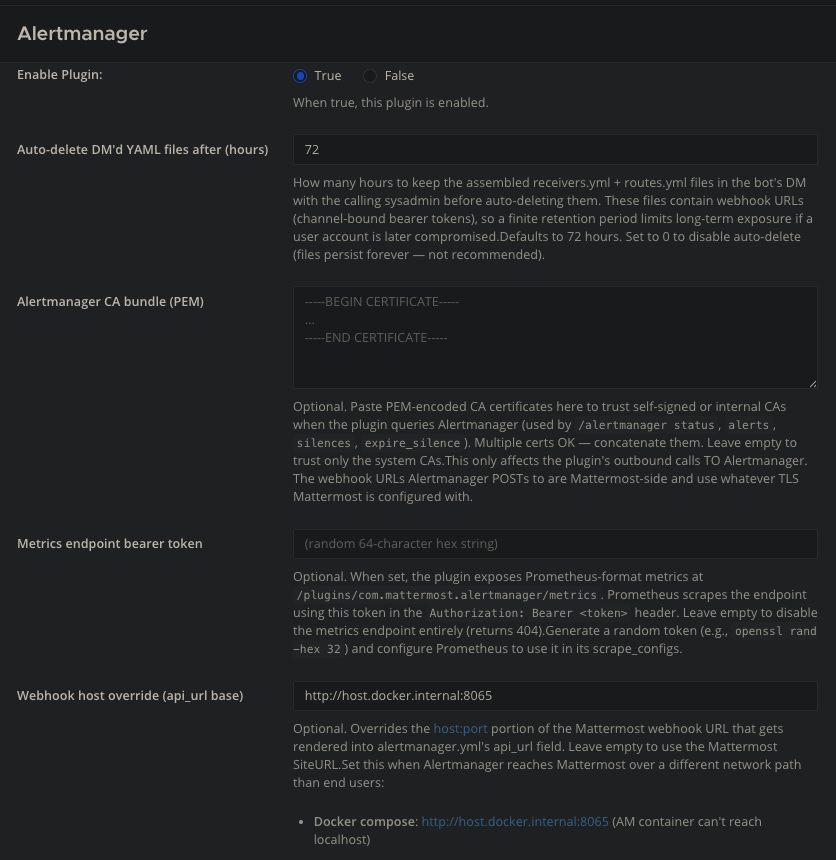
System Console → Plugins → Alertmanager. All optional — defaults work for a basic setup.
| Setting | What it does | When you need it |
|---|---|---|
| Webhook host override | Replaces the host in the generated api_url so Alertmanager can reach Mattermost over a different network path |
Docker/K8s where AM can't hit your SiteURL (see KUBERNETES.md) |
| Alertmanager CA bundle (PEM) | Trust bundle for a TLS Alertmanager | AM served over HTTPS with a private CA |
| Metrics endpoint bearer token | Auth for the plugin's /metrics endpoint |
Only if Prometheus will scrape the plugin — see Step 8 |
| Auto-delete DM'd YAML after (hours) | TTL on exported config files DM'd to you | Tighten if the YAML embeds sensitive hosts |
| Webhook rotation reminder (days) | Nudges to rotate webhooks | Opt-in per receiver with the on flag on add |
Step 3 — Bind a channel to alerts [Mattermost]
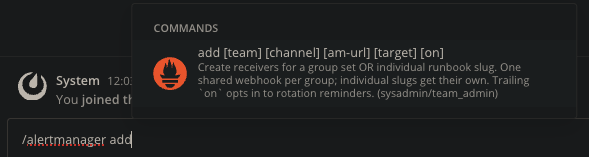
In the channel where you want alerts, run:
/alertmanager add <team> <channel> <alertmanager-url> <target>
<target>is a runbook set (all,compute,application,database,storage,networking,observability,security) or a single runbook slug (e.g.pod-crashloopbackoff).- Add a trailing
onto opt these receivers into rotation reminders.
Example:
/alertmanager add sre-team incidents http://alertmanager.monitoring:9093 compute
This creates the Mattermost incoming webhook and registers the receivers.
/alertmanager list shows what's bound to the current channel.
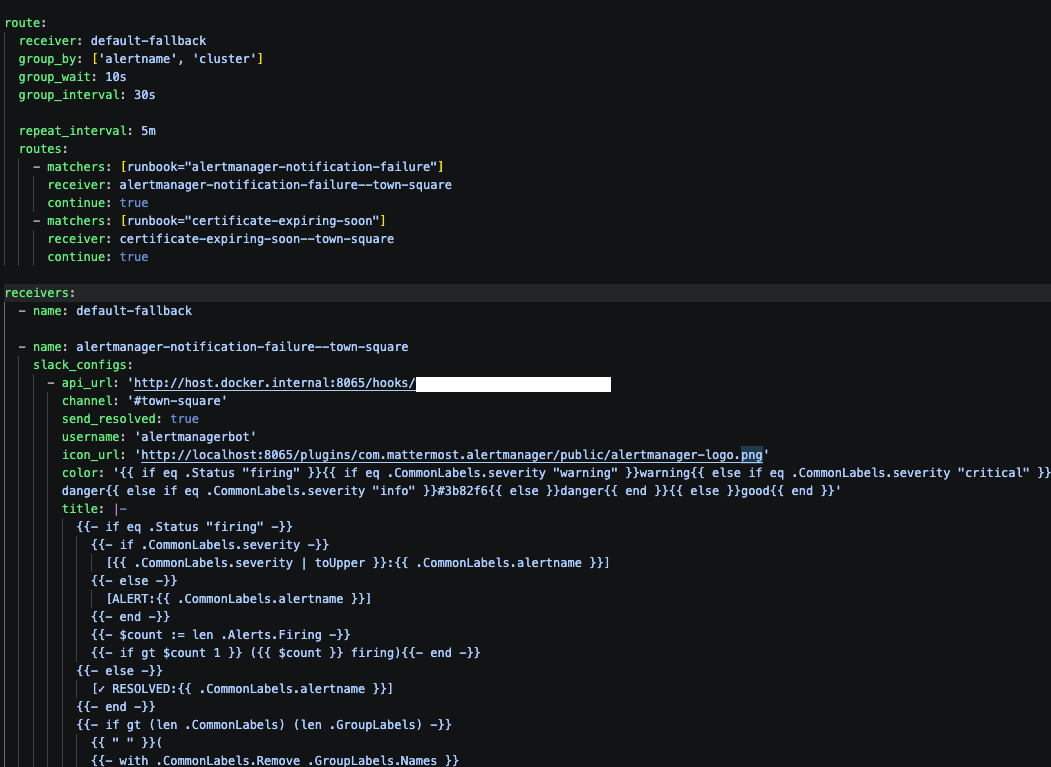
Step 4 — Get the Alertmanager config [Mattermost]
/alertmanager export
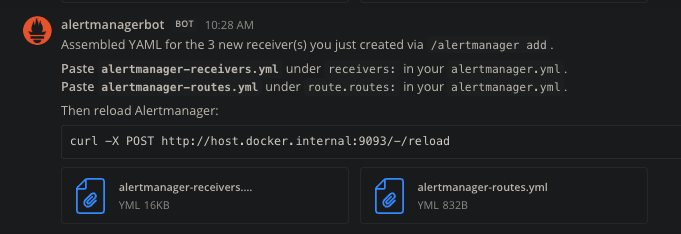
The bot DMs you alertmanager-receivers.yml and alertmanager-routes.yml for
this channel. Inside you'll find the receiver (with the webhook URL) and its
slack_configs text template — the runbook's kubectl diagnostics with
{{ .Labels.namespace }} / {{ .Labels.pod }} placeholders that Alertmanager
fills at alert time.
The receiver is a
slack_configsblock, notwebhook_configs. Mattermost's incoming webhook speaks the Slack payload format, so Alertmanager's Slack receiver posts to it directly — no adapter needed.
Step 5 — Wire it into Alertmanager [Alertmanager]
Paste the exported receivers: and route: blocks into your alertmanager.yml,
then reload Alertmanager (SIGHUP, POST /-/reload, or your operator's
reload). If AM is HTTPS with a private CA, set the CA bundle setting
(Step 2). If AM can't reach your SiteURL, set the Webhook host override.
Step 6 — Emit the labels the runbooks render from [Prometheus]
The diagnostic commands are only runnable if the alert carries the labels
they reference. For pod runbooks that's namespace and pod. A missing label
renders as <no value> in the command. Make sure your alert rules include them:
- alert: KubePodCrashLooping
  expr: increase(kube_pod_container_status_restarts_total[15m]) > 3
  labels:
    severity: critical
  annotations:
    summary: "Pod {{ $labels.pod }} is crashlooping"
  # namespace + pod come through from the metric's labels automatically here;
  # if you aggregate them away, re-attach them so the runbook can render.
Step 7 — Fire a test alert & verify [Alertmanager] / [Mattermost]
Trigger a synthetic alert — amtool alert add alertname=KubePodCrashLooping namespace=production pod=payments-api-7d9f4-xk2p9 severity=critical, or use the
plugin's admin inventory test tool
(/plugins/com.mattermost.alertmanager/admin/inventory, sysadmin only).
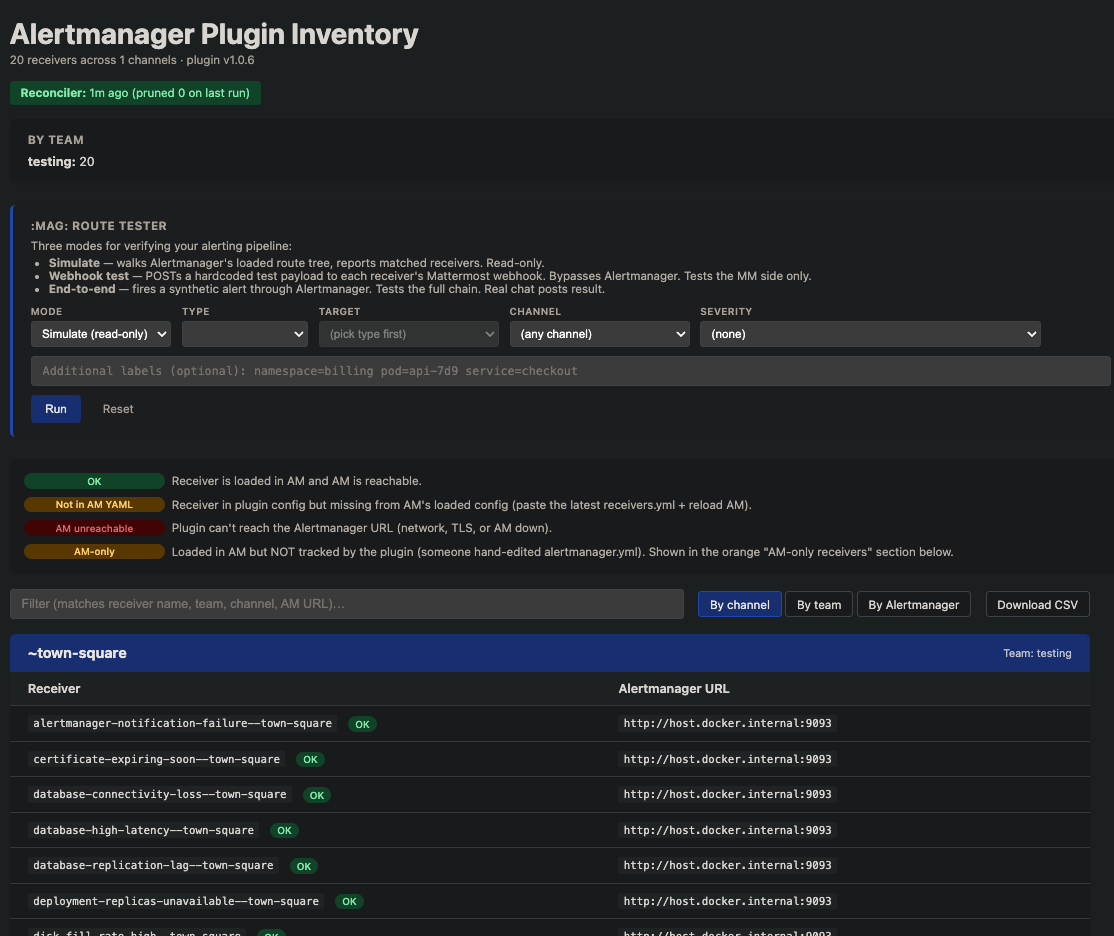
The admin inventory offers three test modes, in increasing coverage:
- Simulate — walks Alertmanager's loaded route tree and reports which receivers would match. Read-only; touches nothing.
- Webhook test — POSTs a hardcoded test payload straight to each receiver's Mattermost webhook. Bypasses Alertmanager — tests the Mattermost side only.
- End-to-end — fires a synthetic alert through Alertmanager. Tests the full chain and produces a real channel post.
The Simulate mode doubles as a config-drift check: it flags receivers that are
in the plugin but missing from the loaded Alertmanager YAML, and "AM-only"
receivers hand-edited into alertmanager.yml that the plugin doesn't track.
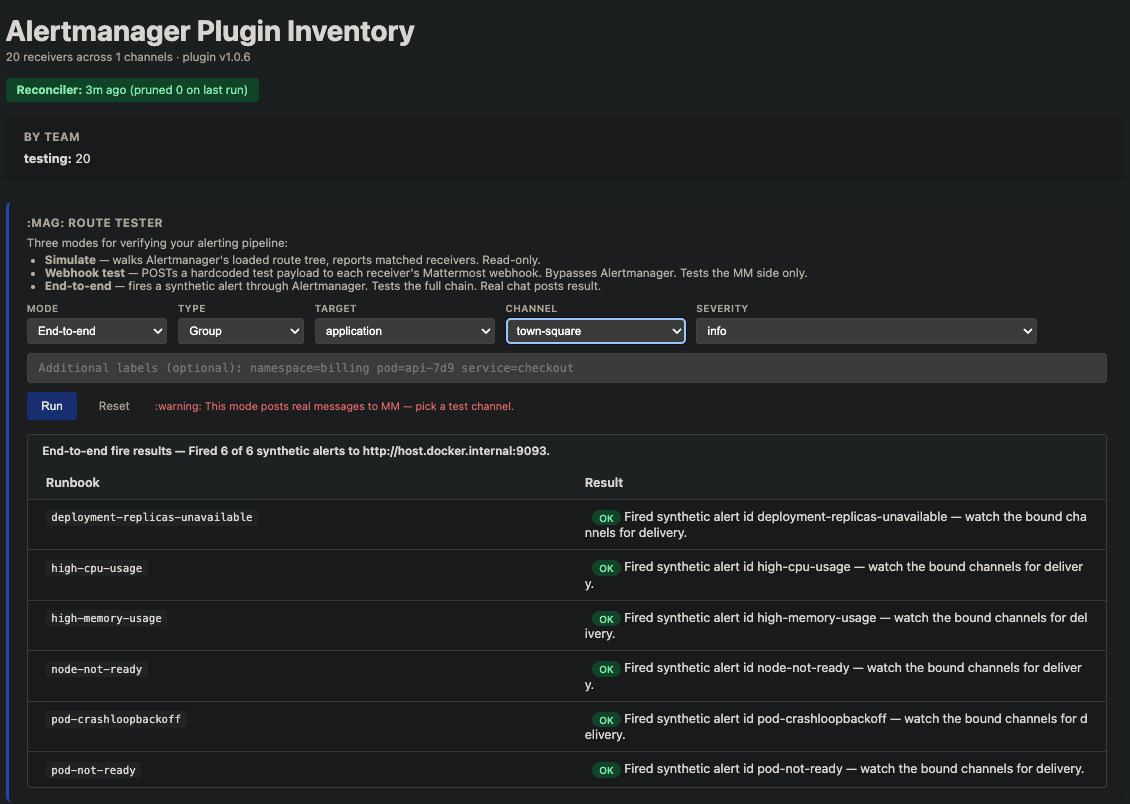
An End-to-end run posts a self-resolving synthetic alert to the channel so you can confirm delivery without a real incident:
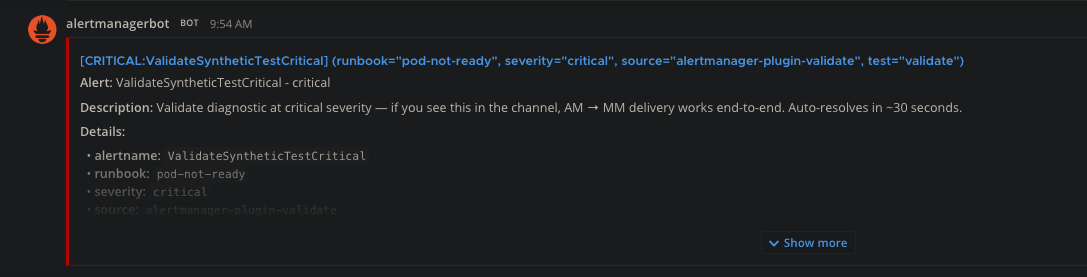
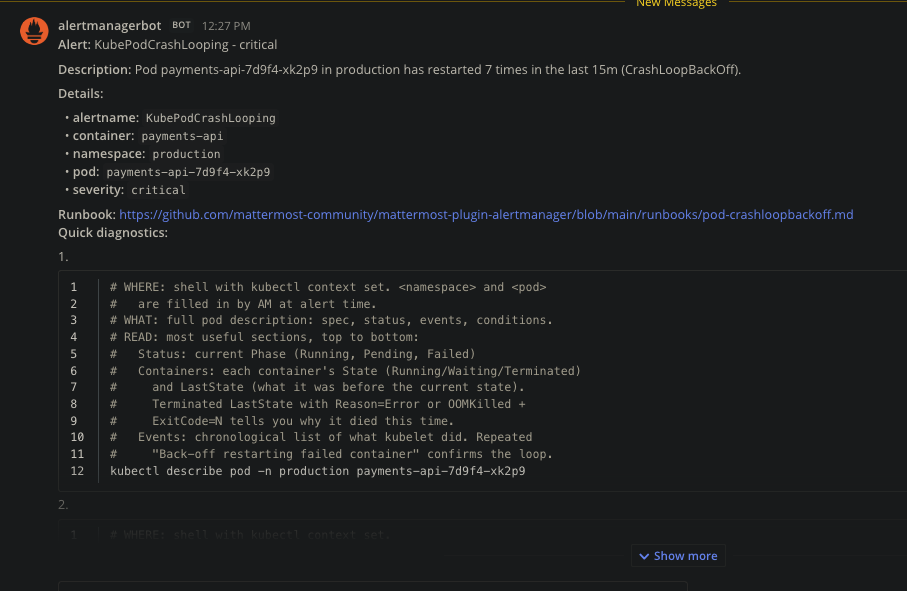
Either way, you should see the alert post in the channel with the three
kubectl commands and namespace/pod filled in — this is the payoff:
Step 8 — (Optional) let Prometheus scrape the plugin [Prometheus]
This is the only place a token is involved, and it's optional — it has nothing to do with alert delivery. It lets Prometheus scrape the plugin's own metrics (receiver counts per channel, etc.).
Prometheus scrapes from outside Mattermost's login/session auth, so the
/metrics endpoint is protected by a shared bearer token — the
Metrics endpoint bearer token setting (Step 2). Set it, then add a scrape
job:
- job_name: mattermost-alertmanager-plugin
  scheme: https
  metrics_path: /plugins/com.mattermost.alertmanager/metrics
  authorization:
    credentials: <MetricsToken value from Step 2>
  static_configs:
    - targets: ["mattermost.example.com"]
Troubleshooting
| Symptom | Cause | Fix |
|---|---|---|
Links in System Console show __PLUGIN_REPO_URL__ / 404 |
Installed the Source code archive, not the release Asset | Re-install the com.mattermost.alertmanager-*.tar.gz from Assets |
| Re-uploaded the fix but it's still broken | Same version reinstalled; MM kept the old copy | Force-overwrite: mmctl plugin add <bundle> --force (or delete-then-add), then hard-refresh |
Alert commands show <no value> for namespace/pod |
Alert rule doesn't emit those labels | Add namespace/pod labels to the rule (Step 6) |
Posts don't look like @alertmanagerbot |
Override toggles off | Enable both override toggles (Step 1) |
| Alertmanager can't reach the webhook | AM can't hit your SiteURL | Set Webhook host override (Step 2) / see KUBERNETES.md |
/metrics returns 401 |
Token mismatch | Match the Prometheus credentials to the MetricsToken setting |
| Alertmanager TLS handshake fails | Private CA not trusted | Paste the CA into Alertmanager CA bundle (Step 2) |
Go deeper
- CONFIGURATION.md — every setting in detail
- SLASH_COMMANDS.md — full command reference
- KUBERNETES.md — in-cluster networking, CA, reachability
- ROTATION.md — webhook rotation reminders
- ARCHITECTURE.md — how it all works under the hood